

Introduction
As the pandemic hit everywhere and as the lockdowns were imposed, we saw more people spending their time at home and with family and friends in their bubble. This practice became more prevalent during the winter months when safe outdoor socializing was no longer possible. To break the monotony of stay-at-home life, people turned to much-loved pass time of playing boardgames.
A Today.com article reporting on the boardgame surge in popularity stated that Hasbro, a popular game-making company had reported a 20% growth in sales in the third quarter of 2020 compared to 2019 at the same time, and similarly Mattel, another game-maker showed that game sales were up 48% in 2020. People started looking at sites, myself included, such as Board Game Geek (BGG) to look at some of the top board games and their ratings before deciding on which games to buy. This site also includes a page with a list of the top 100 board games ranked based on their Geek Rating.
Question of Interest
From a preliminary BGG site review, it can be deduced that a board game’s user ratings on any online platform can be analogous to its overall popularity. For this project, I decided to research whether certain metrics on an online board game database platform contribute to a board game's rating/popularity. I decided to use a dataset from Kaggle - 20,000 Boardgames Dataset that used data for 20,000 boardgames directly scraped from the BGG site.
This project compares BGG Geek Rating to different metrics to see if they influence the game’s rating in any way. This project aims to aid Game Developers trying to increase their game’s low user rating/popularity and eventually increase sales for the game or those developing a new game and looking to research the best metrics to incorporate in order to maximize future game ratings.
Dataset Introduction
Before we begin, let us discuss what the BGG site's Geek Rating is. As per a blog from the site The Board Game Detective, Geek Rating is a value that is computed using the User Ratings as input but with some alterations. BGG site mentions that this rating prevents games with relatively few votes from climbing to the top of the BGG Ranks, and artificial "dummy" votes are added to the User Ratings to come up with these ratings.
The dataset that I used, contains a vast amount of information for several board games including their ranks and rating such as their genre, the year the game was published, game playing time, minimum payer age, name and counts of developers/designers, social media blog, podcast, article counts, etc. Some features that I was interested in for this project were as follows:
- Site views for games on the BGG site.
- The total number of awards won by the game.
- Mentions of the game in different media types such as news/online review articles, blog posts, and podcasts.
- Different categories/genres of the game.
- Minimum and maximum playing time for the game.
Geek Rating Evaluation
When I conducted a geek rating evaluation for all the games, I discovered that most of the games lie between the rating range of 5 through 7. Also, from the histogram below we can see that the geek rating category >5 and <6 has the highest number of games among all other categories.

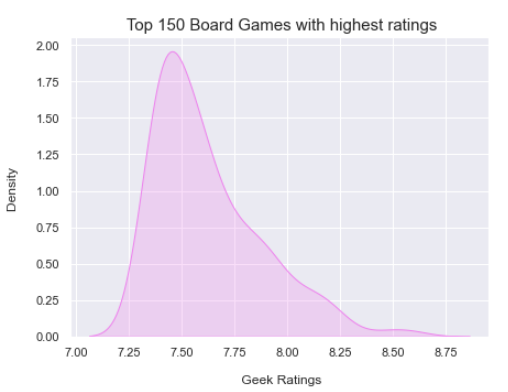
Similarly, if we look at the top and bottom 150 games sorted by their geek rating, we can see that most of the top 150 highest-rated games lie between the 7 through 9 range. Also, most of the 150 lowest-rated games lie between the 3.5 through 5.5 range.

Site Views Evaluation
Next in this research, I looked at the relationship between site views (views for the board game on the BGG site) and geek ratings for different board games. When I studied the number of site views (in millions) and geek rating, it became obvious that for the top 150 highest-rated games, as the site views increased the game's rating increased as well.
The same could not be said however for the 150 lowest-rated games (for the purpose of this project only games with rating > 0 were included). For these games, the site views generally stayed below 1 million regardless of what the geek rating was. Overall, from all 20,000 games, in the games with ratings > 6.5 a trend of rising in rating with increased site views was seen.

Game Awards Evaluation

In this project, the next thing I wanted to review was the number of awards top and bottom 20 rated games have received. For this study, I looked at 20 highest-rated games and 20 lowest-rated games after excluding games that had a rating of 0 and the games which had received at least one award. What I uncovered was that the top-rated games had received more awards (some games had received upwards of 20 awards), while the bottom-rated games received only one or two awards between them.

What I also found out was that if we look at the average award counts per geek rating category, the highest rating category also had a high average awards count (greater than all other categories).

Media Exposure Evaluation
For the next evaluation, the feature of interest will be compared with site views as higher site views can translate to higher ratings. From the graph and the table listed below, it looks like higher rating categories have high median site views.

For this next evaluation, I looked at whether there was a relationship between the count of game-related media content and a game's geek ratings. The media types that were looked at were:
- Podcasts: External game-related podcasts
- Weblinks: External game-related media/content
- BGG News articles
- BGG Blog posts
For this evaluation, games with geek rating greater than 0, site views less than 6 million, and having least one game-related media content were looked at.


From the above graphs, we can see that there is a definite trend between the number of podcasts and web links mentioning the game and the site views for the game on its page on the BGG site. Generally, the higher the number of articles written higher the site views were found to be. The same could be said true for blogs written by the BGG site; however, not for the news articles written by BGG.


Game Genre vs. Rating Evaluation
I also studied the game genres having highest average geek rating in each of the rating categories and found out that some game genres such as Adventure, Medieval, City Building, Exploration, Miniatures and Civilization are more common in the games in top two higher rating categories.

Maximum and Minimum playing time per rating category
For the last evaluation, I looked at minimum and maximum playing time for the top two highest-rated categories. What we notice here is that the minimum paying time for each category lies between 30 minutes to 60 minutes for most of the games and the maximum playing time lies in a broader range of 30 min to 120 minutes.


Takeaways/Conclusions
- Game developers can work towards getting their game more exposure on gaming database sites. Higher game site views could translate to higher ratings for the game.
- Developers can promote awards the game has won on game sites so potential customers can read about it, gauge quality and competency, rate the game accordingly and make sales-related decisions based on it.
- Quality game-related media content (especially blogposts and podcasts) on the site can boost viewability, possibly game rating, and eventually sales.
- More publicity and media coverage a game would get, the more popular it would be which may in turn drive up sales.
- New game developers can focus on developing games with certain genres listed below for a rating boost:
- Adventure
- Medieval
- City Building
- Miniatures
- Civilization
- Exploration
- New game developers can focus on using a certain minimum or maximum game playing time (recommendations listed below) for future game rating positive impact.
- Minimum playing time: 30 min to 60 min.
- Maximum playing time: at least 30 min and no more than 120 min.
Future Work
- Evaluation of data from other gaming database platforms to compare findings.
- To evaluate whether a game’s rating influences its price and sales.
- Further research for rated games, to see the number of times consumers click on game sales links on database platforms (if available) to demonstrate an interest in the game.